 Helpdesk
| World Agriculture Trade Overview | |||||||||||||||||||||
| Global Agriculture Trade 2024 - US$ 2.46 trillion. | |||||||||||||||||||||
|
 |
||||||||||||||||||||
 |
|||||||||||||||||||||
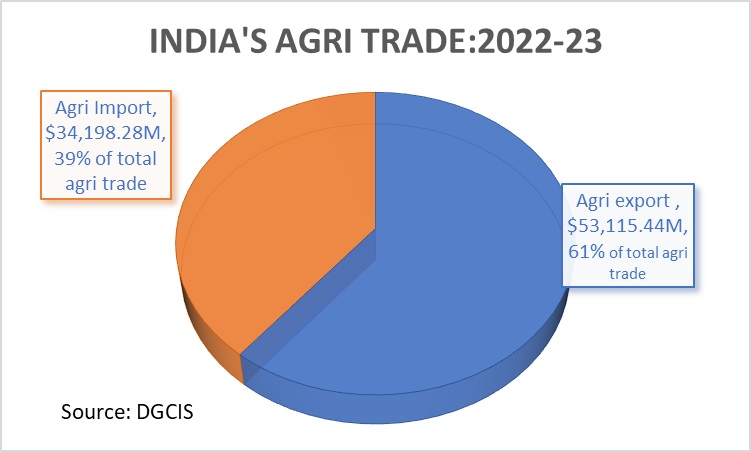
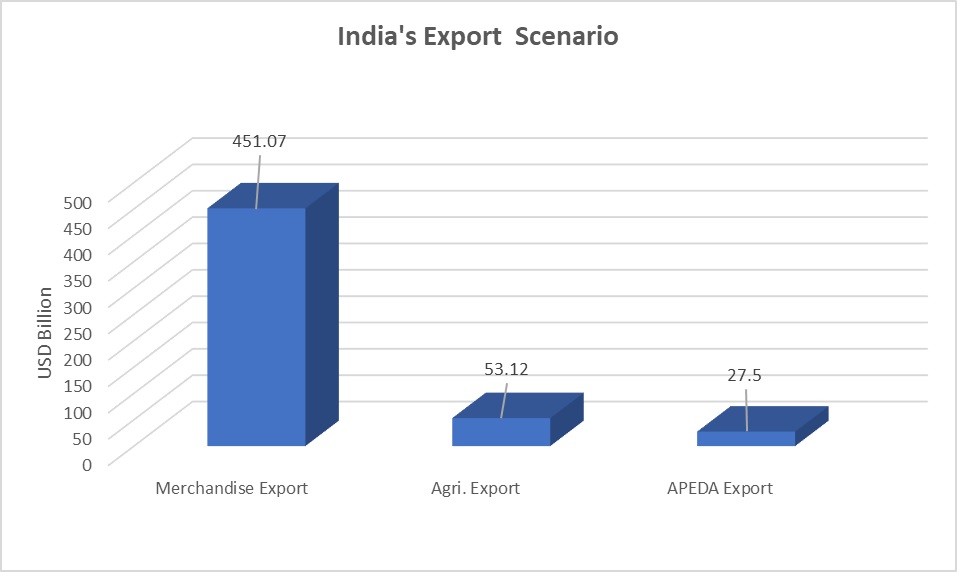
| India’s Export Overview | ||||||||
| During 2024-25, India's total merchandise exports stands at US$ 437.70 billion out of which Agri. products contributed US$ 51.91 billion which is 11.86% of total export. Export of products monitored by APEDA was at US$ 27.90 billion (As per PC data export) (53.75% of all Agri. products). | ||||||||
|
||||||||
 |
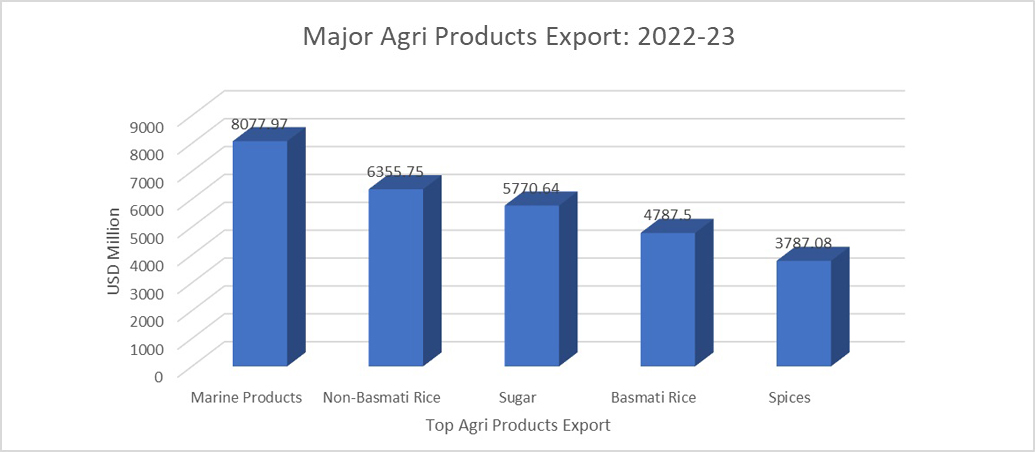
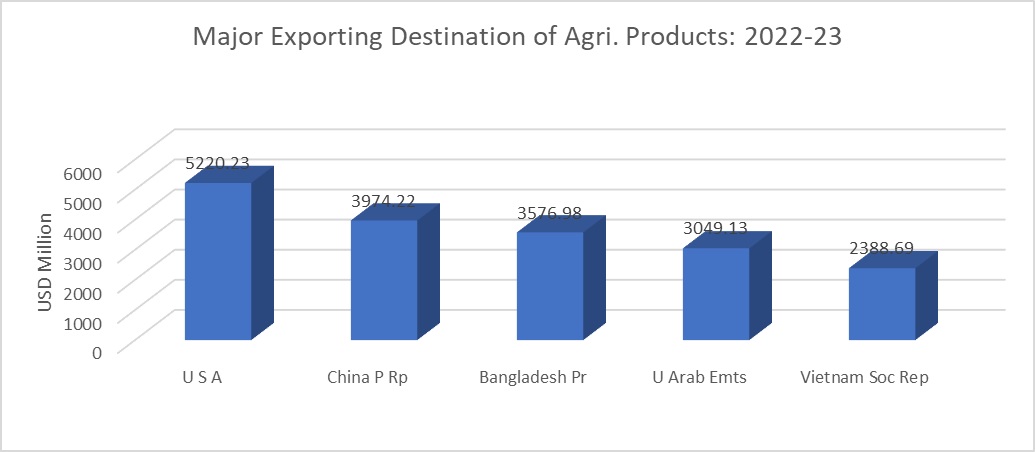
| India’s Agri Products Exports & Major Destinations |
| Indian agricultural/horticultural and processed foods are exported to more than 200 countries/regions. In 2024-25, top 10 Agri exported commodities (As per PC export) were Marine products (US$ 7.41 billion), Non- Basmati rice (US$ 6.53 billion), Basmati rice (US$ 5.94 billion), Spices (US$ 4.45 billion), Buffalo meat (US$ 4.06 billion), Sugar (US$ 2.16 billion), Coffee (US$ 1.81 billion), Misc Processed Items (US$ 1.68 billion), Tobacco Unmanufactured (US$ 1.48 billion) and Oil meals (US$ 1.34 billion). Top 10 destinations of India's Agri exports are U S A, UAE, China, Bangladesh, Saudi Arab, Vietnam, Iraq, Malaysia, Indonesia and Benin. |
 |
 |
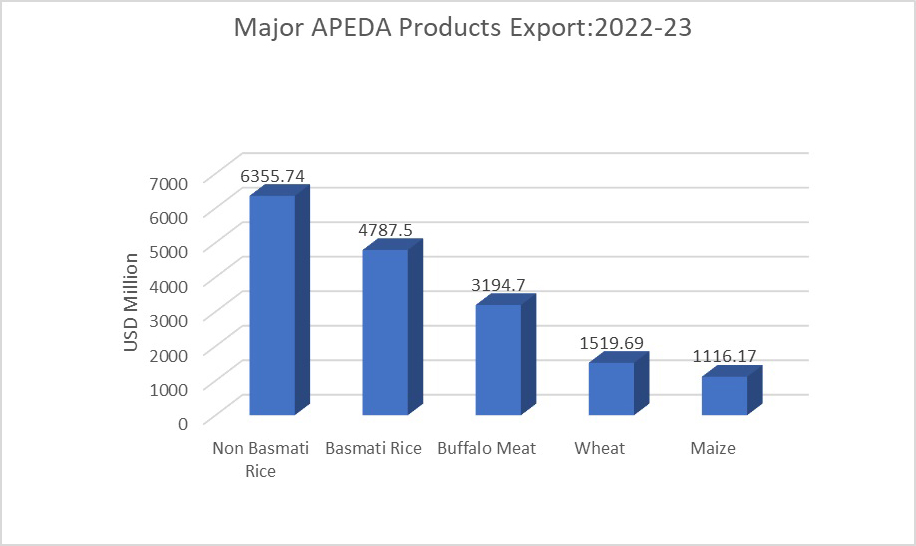
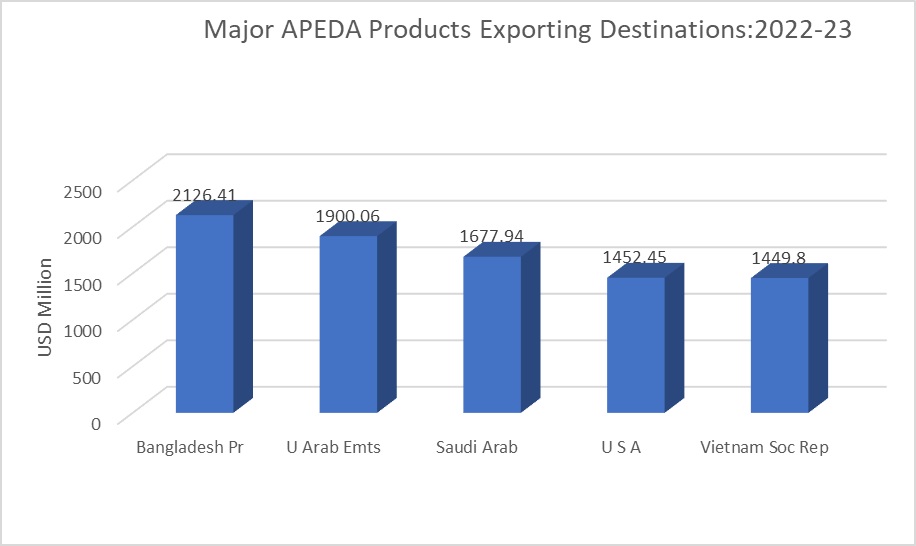
| India’s APEDA Products Exports & Major Destinations | |
| In 2024-25, top 10 APEDA exported commodities (As per PC export) were Non-Basmati rice (US$ 6.53 billion), Basmati rice (US$ 5.94 billion), Buffalo meat (US$ 4.06 billion), Misc Processed Items (US$ 1.68 billion), Fresh Fruits (US$ 1.17 billion), Processed Fruits & Juices (US$ 1.03 billion), Cereal Preparations (US$ 0.93 billion), Fresh Vegetables (US$ 0.89 billion), Groundnuts (US$ 0.79 billion) and Pulses (US$ 0.78 billion). Top 10 destinations of India's APEDA exports are UAE, Saudi Arab, USA, , Iraq, Vietnam, Malaysia, Bangladesh, Benin, Iran and Indonesia. | |
 |
 |